RECORDED WEBINAR: Container Shipping Market Overview & Outlook Q1 2023: Demand recovery from second half of 2023 but supply grows significantly faster
Overview
Increasing ship deliveries and slowing volume growth will weaken supply/demand balance, possibly to levels not seen during the past ten years.
Highlights
- Significant weakening of the underlying supply/demand balance with more downsides than upsides.
- Freight rates, time charter rates, and second-ship values all under pressure throughout 2023 and 2024.
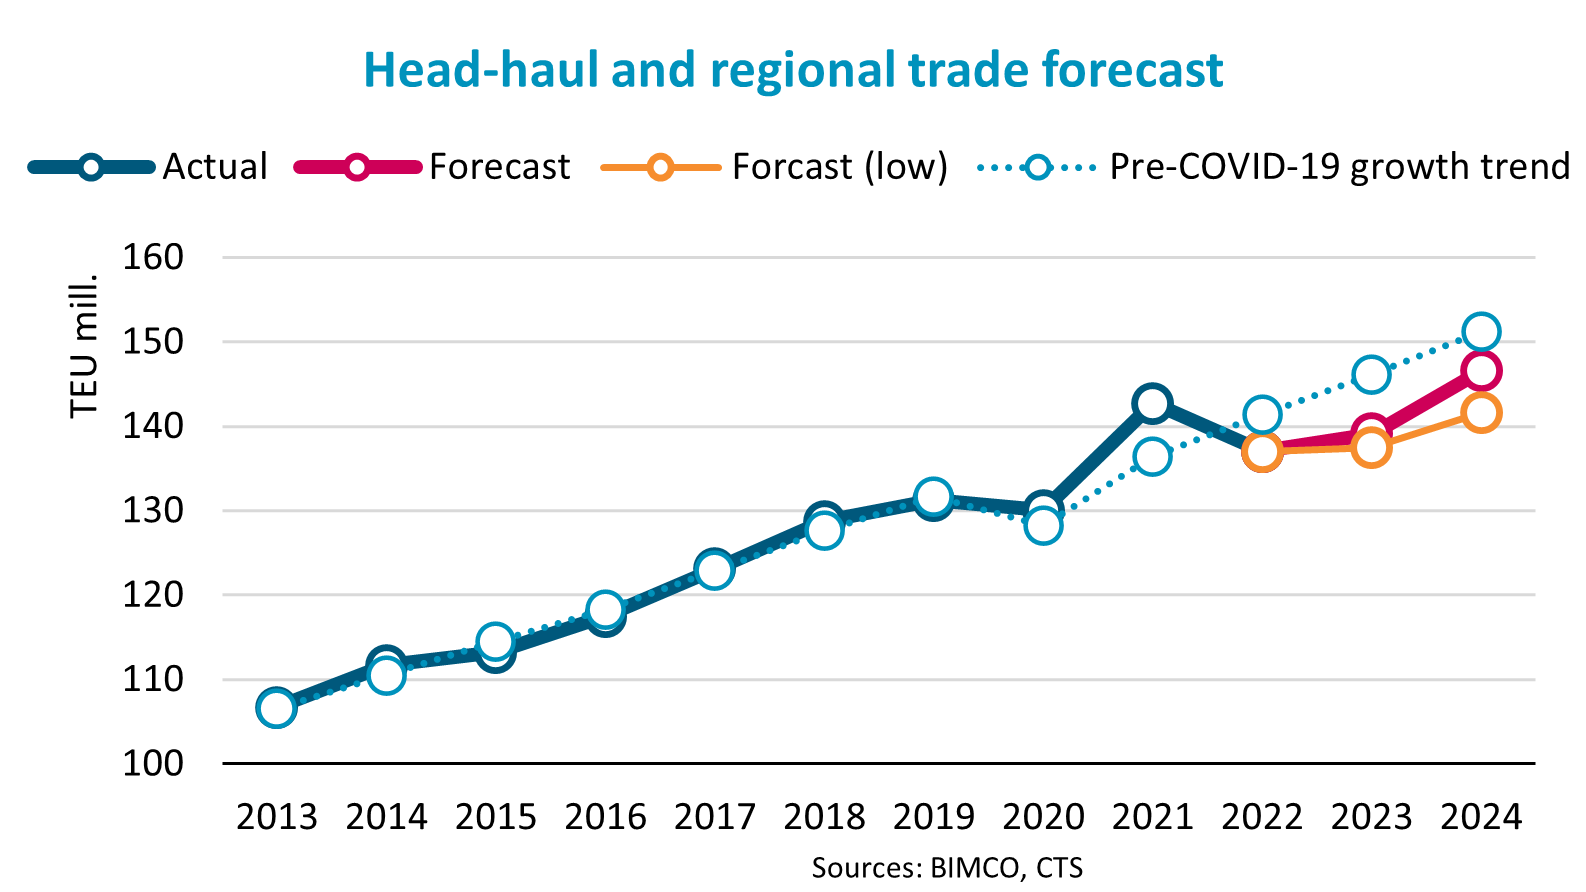
- Head-haul and regional trade demand growth of 1-2% in 2023 followed by 5-6% in 2024. Negative y/y growth through the first half of 2023 but return to growth thereafter.
- Risks remain and in our downside scenario we instead estimate growth of 0-1% and 2.5-3.5% in respectively 2023 and 2024.
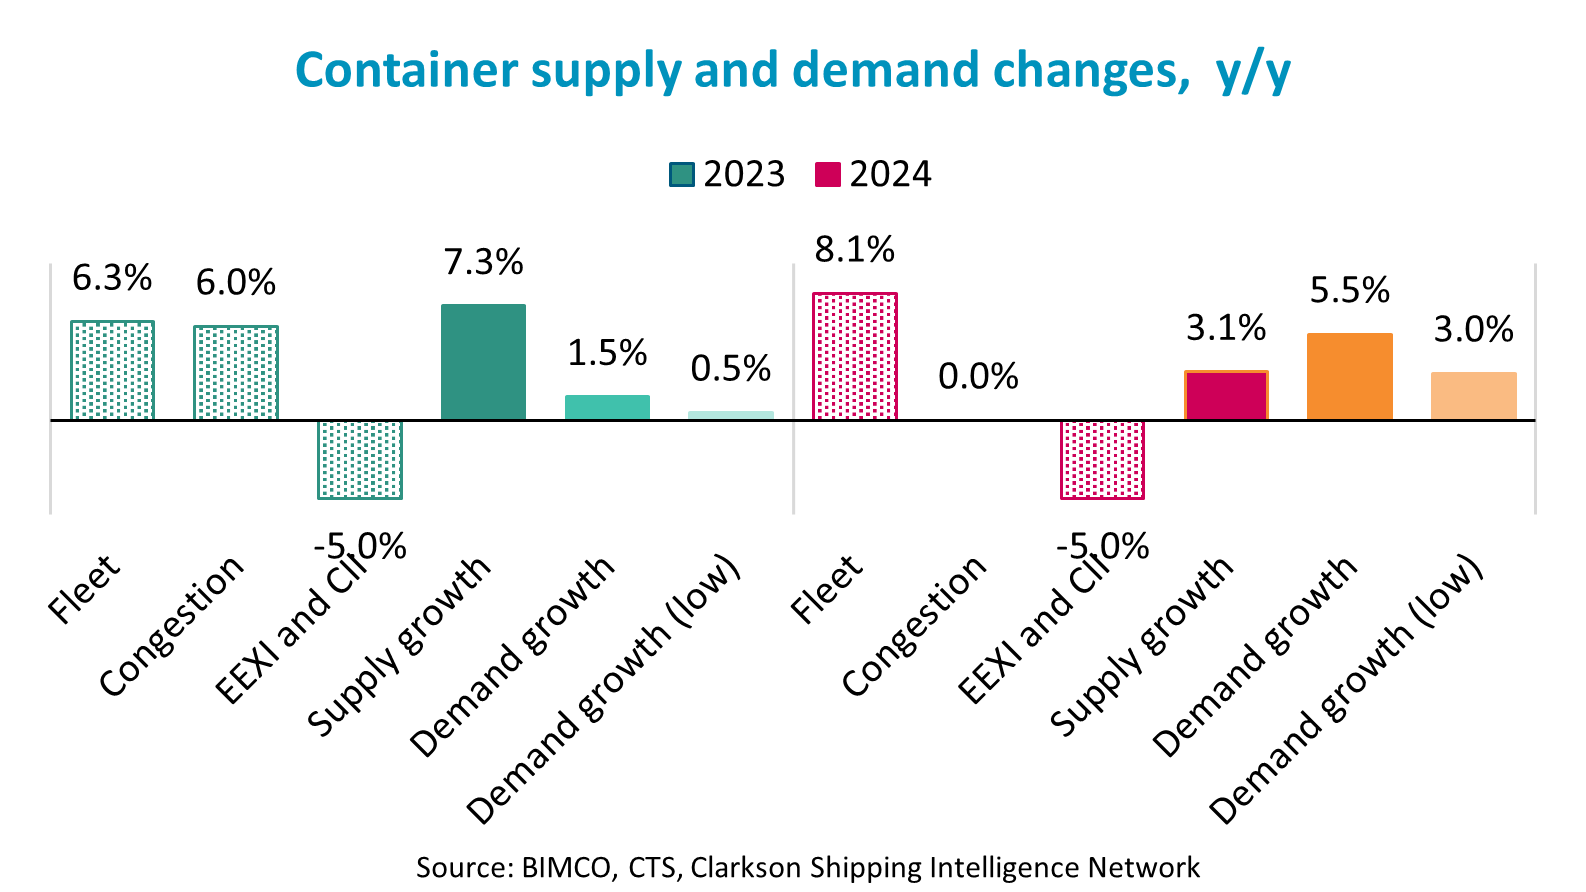
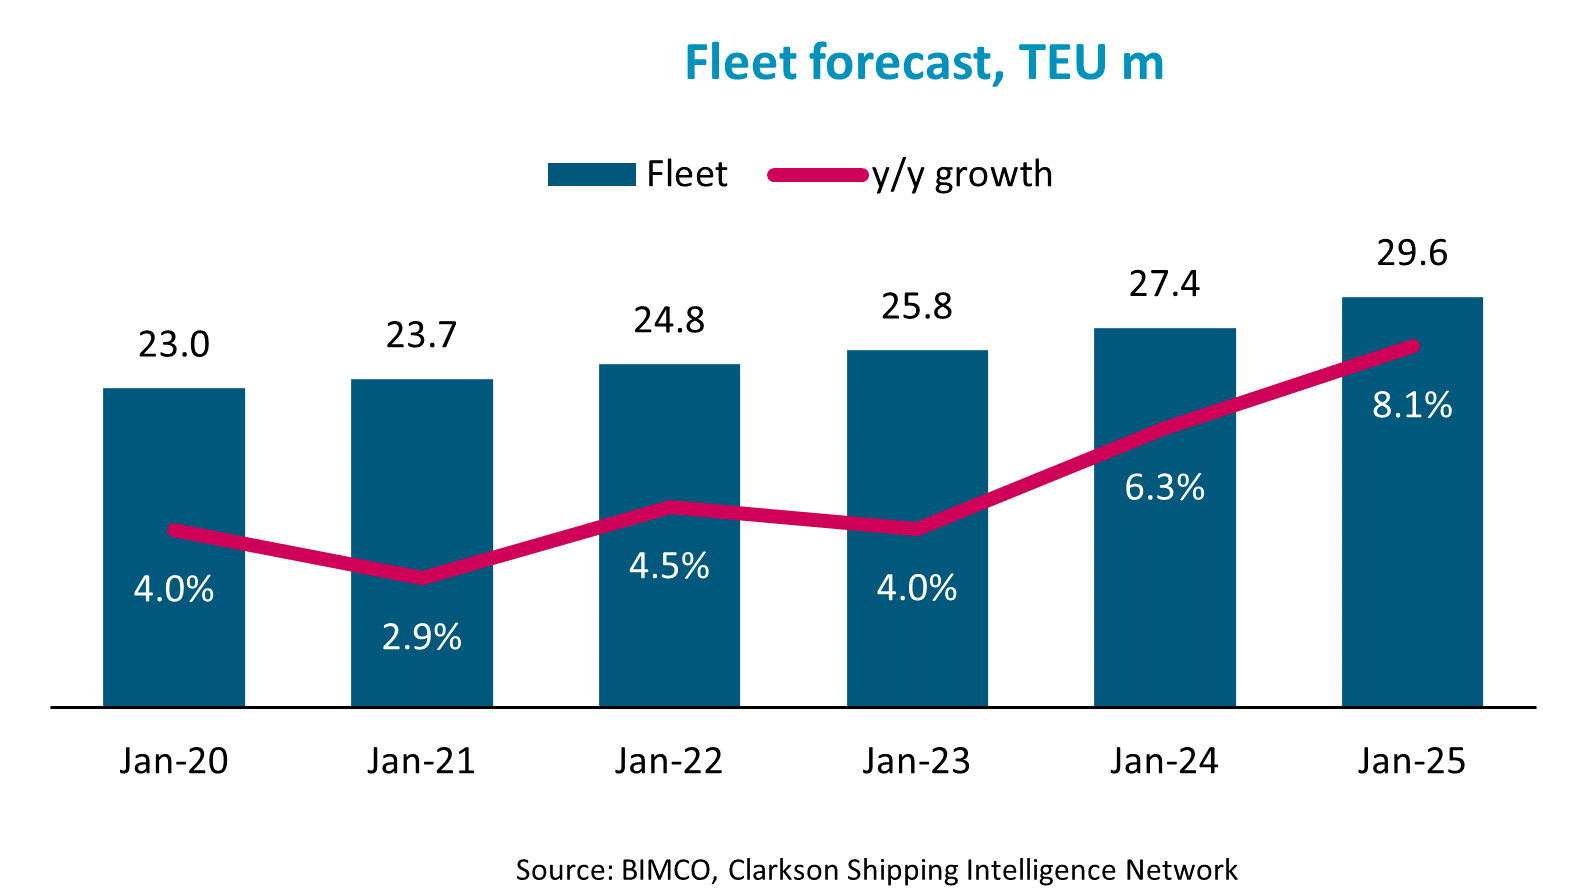
- Fleet growth of 6.3% and 8.1% in 2023 and 2024 respectively, while changes in congestion and sailing speed lead supply growth to outpace fleet growth in 2023 but will trail fleet growth in 2024.
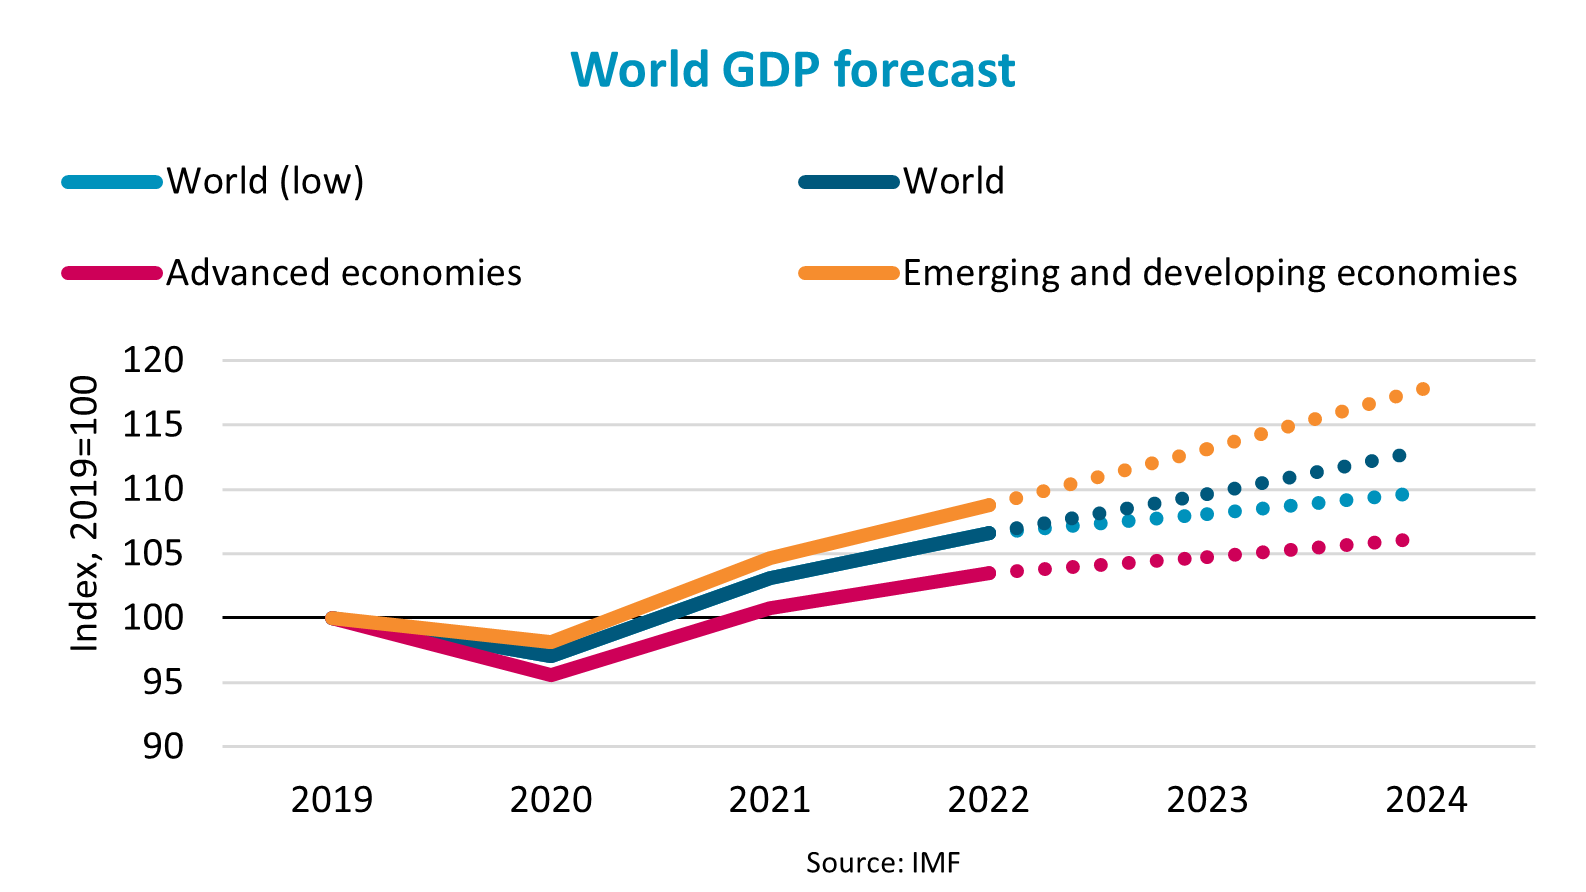
- The IMF predicts global GDP growth of 2.9% in 2023 and 3.1% in 2024 but highlights that the balance of risks remains weighted on the downside.
- So far, liner operators have not been able to adjust capacity offered in line with demand and it is unclear whether the released 2023 service plans sufficiently address this imbalance.
- While average sailing speed has decreased following the reduction in congestion there is so far no evidence of the structural shift downwards due to EEXI/CII that had been previously indicated by major liner operators. We therefore predict that changes will be gradually phased in during 2023 and 2024.
Demand drivers
Despite an improvement in the global economic outlook compared to our previous report, we have lowered our demand growth expectation for 2023 while increasing it for 2024. In 2023, we now expect growth in head-haul and regional trades to end in the 1-2% range rather than the 3-4% that had been previously predicted. On the other hand, we have increased our demand growth forecast for 2024 by 2 pp and now expect growth of 5-6%. As risks to growth remain, we have also developed a downside scenario that instead predicts growth of only 1-2% and 2.5-3.5% in respectively 2023 and 2024.
Overall, we are basing our prediction on a gradual, but not full, return to the pre-COVID trend line based on the relationship between GDP and head-haul and regional trade volumes. Specifically in the first half of 2023 we must expect a continuation of the business inventories adjustments that began in 2022 and caused head-haul and regional trade volumes to fall by 7.7% in the second half of the year.
The IMF has revised its growth forecast for the global economy to 2.9% in 2023 (+ 0.2 pp) and 3.1% in 2024 (- 0.1 pp). The key driver of the improvement in 2023 is an improved outlook for the Chinese economy following the relaxation of COVID-19 restrictions. This has led the IMF to increase estimated growth in 2023 to 5.2% (up from 4.4%), while the estimate for 2024 has been maintained at 4.5%.
Economic growth in advanced economies has been revised to 1.2% in 2023 (+ 0.1 pp) and 1.4% in 2024 (- 0.2 pp). For the two years, forecasts for USA and the major Euro Area economies have been increased slightly, while those for other major advanced economies have been lowered, although only the UK economy is forecast to contract and end 2024 smaller than it was in 2022.
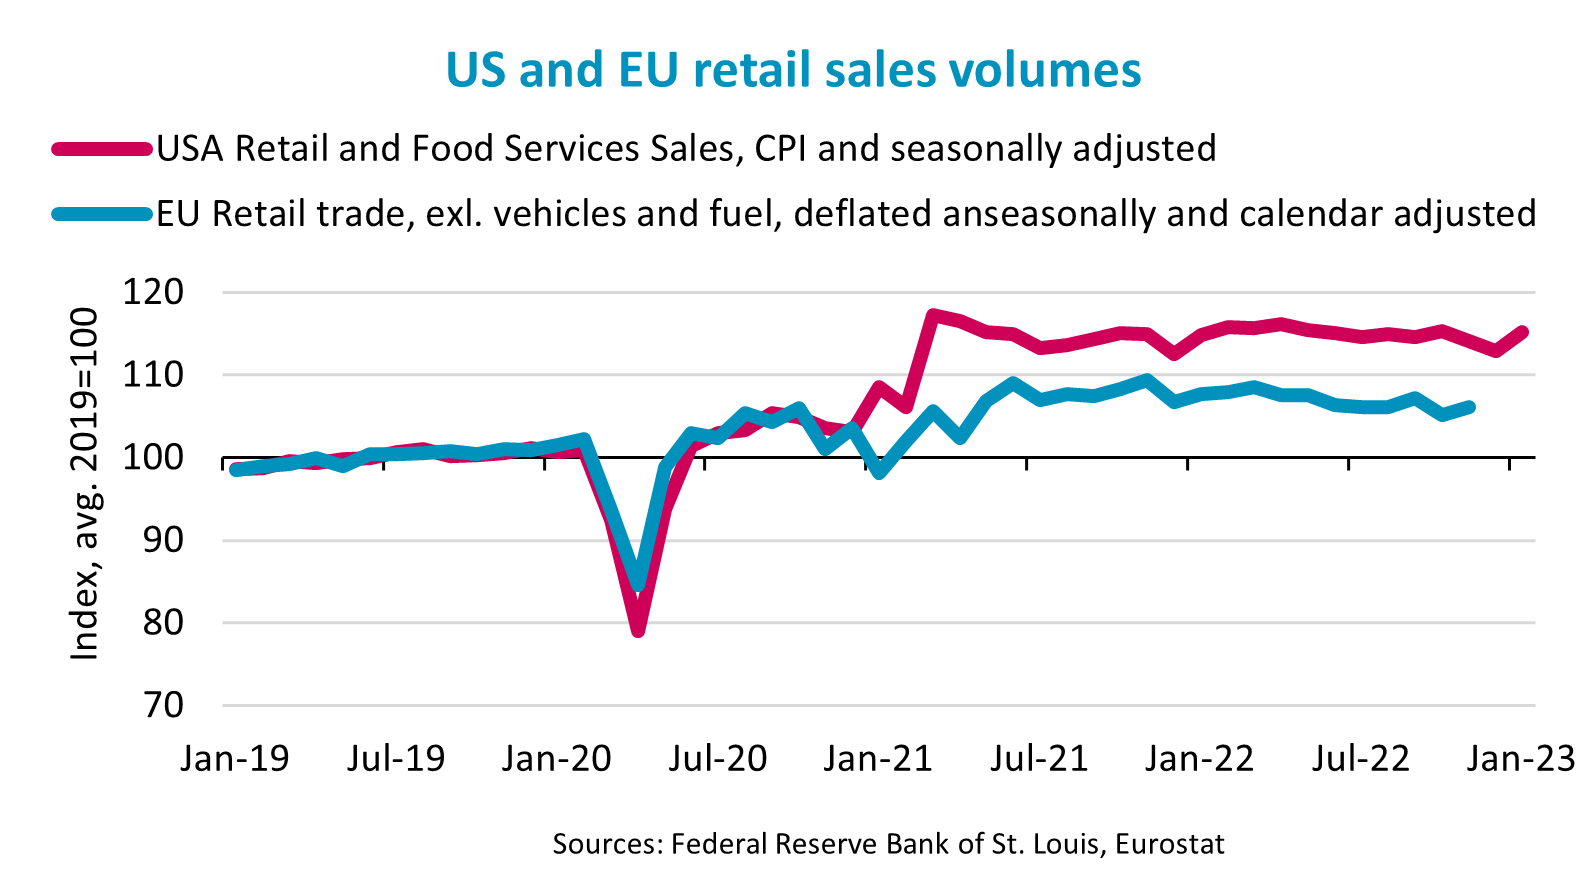
Despite high inflation and increasing interest rates, retail sales volumes in both the US and the EU have remained remarkably resilient. Retail sales adjusted for inflation have only fallen marginally compared to the peak during 2021/2022. In the US, they have fallen by 1.8% compared to the peak in April 2022, whereas retail sales in the EU are now 3.0% lower than they were in October 2021. US data does, however, reveal some strain on consumers as they are dipping into their savings, and more than half of the higher-than-normal savings built up during 2020 and 2021 have now been spent. At the same time, credit card debt has increased to a new all-time high. On a positive note, inflation in the US has been declining and average wages have finally caught up.
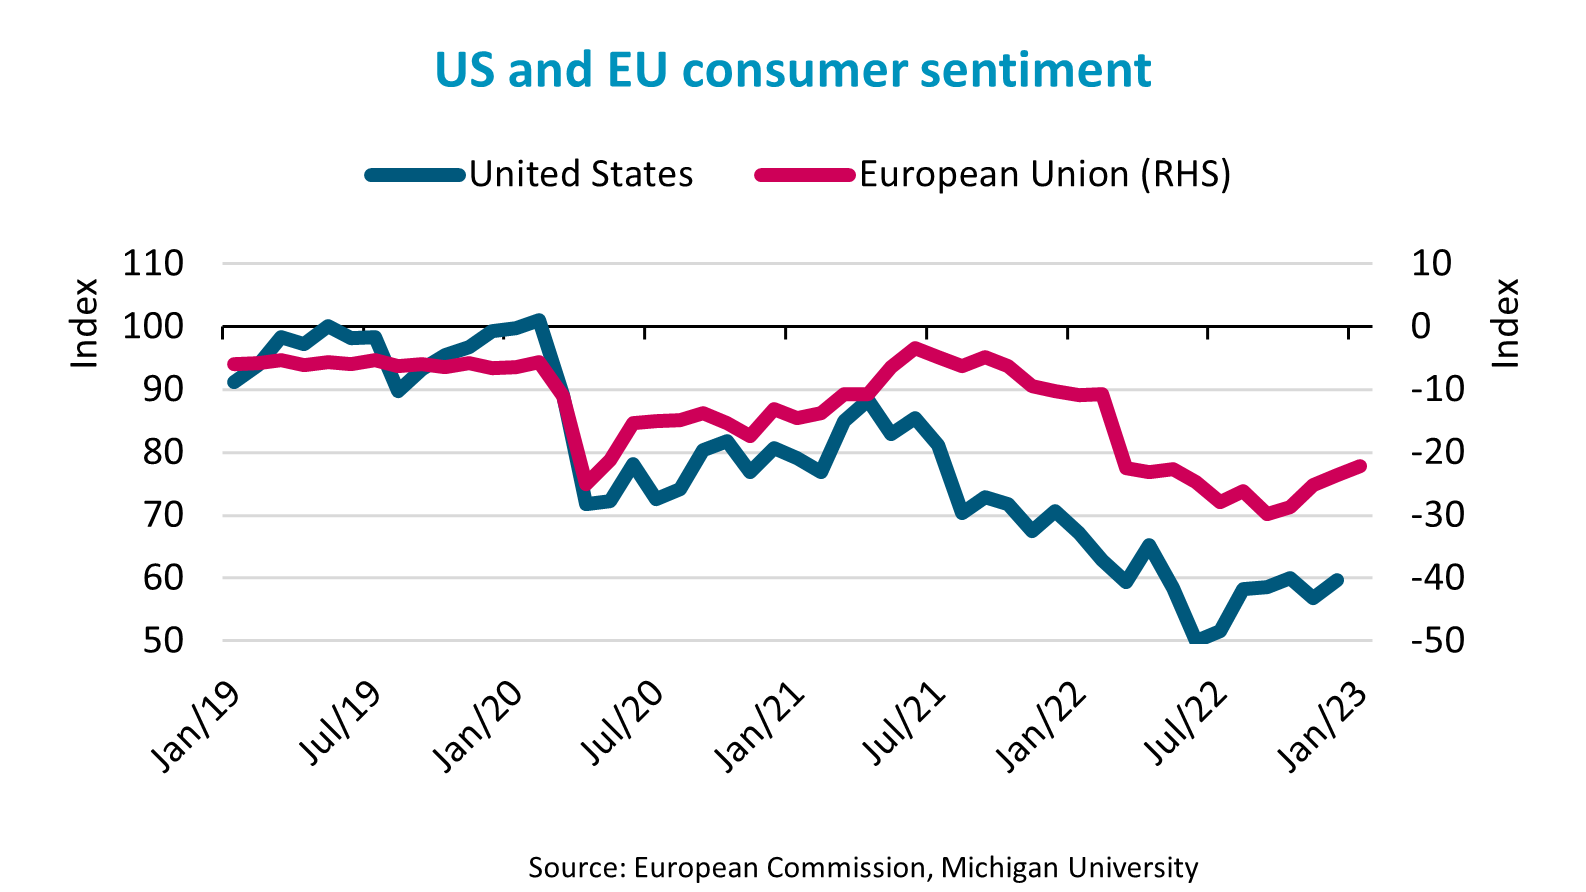
Although it has showed some recent improvement, consumer sentiment in both EU and US remains near the all-time lows recorded during 2022. We believe that it may improve during 2023 if/when inflation recedes and interest rates peaks, and that this could fuel a rebound in container volumes.
Except for the Far East and North America regions, import head-haul and regional trade volumes into all regions ended 2022 lower than would have been expected considering the economic growth.
Taking the ongoing inventory adjustments, high inflation, and increases in interest rates into consideration, we have placed our base line forecast 3-5% lower than what we consider to be the maximum potential.
Lower-than-predicted economic growth remains, along with continued high inflation, and interest rates are a key risk. The potential for increased reshoring and friendshoring are also risks, although we find that any such shift would happen in smaller incremental steps rather than in larger shifts that would have an immediate impact.
Supply drivers
After growing by 4.0% in 2022, the container fleet is forecast to grow by 6.3% in 2023 and by 8.1% in 2024. Supply is expected to grow by 11.3% in 2023 and by 3.1% in 2024 as fleet productivity will be impacted by changes in congestion and sailing speed.
We still expect remaining port congestion to be fully resolved during 2023 and release as much as 6% of the fleet in comparison to 2022. However, we have revised our forecast for the impact of CII and EEXI on sailing speeds. Based on public statements by major liner operators, we previously included a 10% reduction in speed in 2023. Mainline ships have already reduced speed; however, this is mainly due to a reduction in congestion, and we have yet to see evidence of the structural shift downwards in speed. We still consider a 10% speed reduction likely but now believe a gradual implementation to be more likely. We have therefore included a 5% speed reduction in both 2023 and 2024.
Deliveries will accelerate due to the larger orderbook built up during the past two years; 4.9 million TEU will be delivered during 2023 and 2024, equivalent to an additional 19% of the fleet size at the beginning of 2023. Recycling of ships will temper actual fleet growth and we have forecast an increase due to worsening market conditions and IMO climate regulations. We predict that nearly 1 million TEU will be recycled.
65% of fleet growth will be concentrated in the segment of ships larger than 15,000 TEU, while the fleet of ships smaller than 3,000 TEU will reduce; the 3,000-8,000 TEU and 8,000-15,000 TEU segments will each account for 18% of growth.
This is likely to drive a further cascading of large ships into trades that are handled by smaller ships and increase the ratio of the smallest ships deployed in the regional trade lanes.
Conclusion
Our forecast predicts head-haul and regional trade volumes that will display negative y/y growth throughout the first half of 2023 but then return to growth for the remainder of 2023 and 2024. Measured in y/y growth, we estimate that Q4 2023 and Q1 2024 will be particularly strong due to the downturn during the same period in 2022/2023.
Supply will, however, outpace demand quite significantly during 2023, and although we expect a tightening of the supply/demand balance in 2024, it will be insufficient to counter the significant weakening that will occur during 2023.
Freight rates, time charter rates, and second-hand vessel prices are expected to remain under pressure throughout our forecasting period. Liner operators can protect freight rates by matching capacity to demand but have so far been unable to do so. At the time of writing, it is unclear whether the service plans released by alliances for 2023 sufficiently addresses this imbalance. Time charter rates will in the short-term continue to be partly insulated against the impacts of the underlying supply/demand balance as ship availability remains tight.
Both demand up- and downsides exist. However, the balance of probabilities appears to be weighted on the downside. Supply could end lower than predicted through delayed delivery or cancellation of newbuildings; equally, Supply could go higher if included speed reductions do not materialise.
Overall, two challenging years lie ahead of the industry, with underlying conditions that will likely be weaker than at any time during the past ten years.
REGISTER FOR THE WEBINARS ON 1 AND 2 MARCH
READ THE TANKER REPORT AND THE DRY BULK REPORT
Feedback or a question about this information?

Posted:
28 February 2023
VPS Bunker Alerts
Veritas Petroleum Services (VPS) publish regular Bunker Alerts based entirely on fuel samples and have kindly permitted BIMCO’s Members to access this information.
The Bunker Alerts are not intended to be an evaluation of overall bunker quality in the port or area concerned, but usually highlight a specific parameter within the fuel which has raised a quality issue.
Latest ice reports for members
Latest piracy reports
Latest industry releasable threats
Related event
Panel discussion: Steering Through Troubled Waters - Shipping in a Disruptive Era
- London,UK
- 10 September, 2024

Niels Rasmussen, Chief Shipping Analyst at BIMCO, will join the panel "Steering Through Troubled Waters - Shipping in a Disruptive Era" at the 16th Annual Ca...
Related publication
BIMCO Bulletin (discontinued)

The archive of BIMCO's digital magazine which was published quarterly until mid-2021.
ELSEWHERE ON BIMCO
Contracts & Clauses
All of BIMCO's most widely used contracts and clauses as well as advice on managing charters and business partners.
Learn about your cargo
For general guidance and information on cargo-related queries.
BIMCO Publications
Want to buy or download a BIMCO publication? Use the link to get access to the ballast water management guide, the ship master’s security manual and many other publications.
About a new business partner
We can help members check new business partners. We also help to recover millions of USD (undisputed) funds every year.

