Please select a reason for contacting BIMCO from the list above to find the best contact number
8 Sep 2021 - Container shipping - onshore disruption leading to record delays and profits
Published: 08 September 2021
As ports and hinterland transport struggle to keep up, delays at ports are soaking up capacity leading to frustration on the shippers’ side and leaving carriers struggling to keep up all the while making record profits.
Drivers of demand and freight rates
The container shipping market has frequently appeared in the headlines over the summer as freight rates and port congestion levels continue to reach record highs. Port closures caused by COVID-19 outbreaks on the export side as well as capacity problems on the import side are all contributing to ships getting stuck in record-breaking queues and missing planned port calls by weeks.
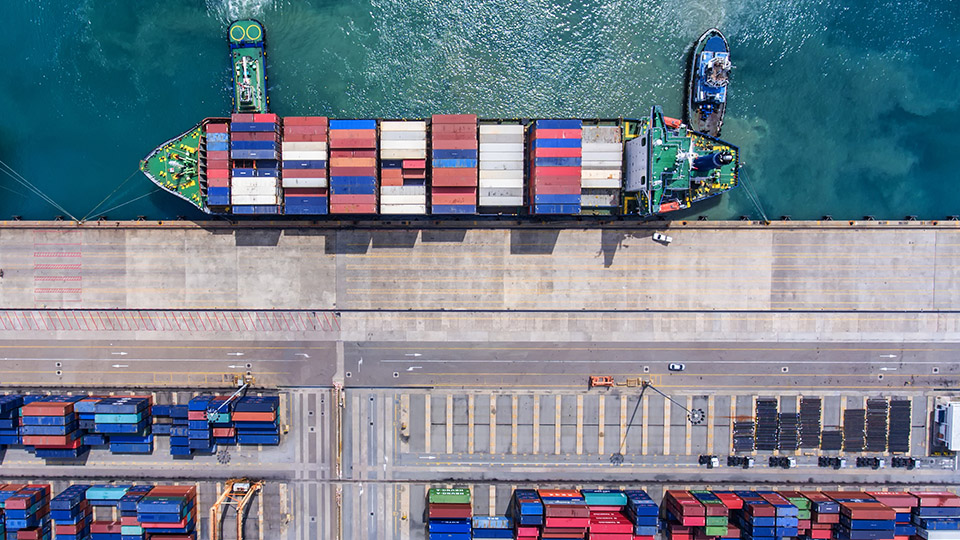
At the end of August, over 40 container ships were waiting to berth outside the ports of Los Angeles and Long Beach alone, with 90% of those arriving at a port having to wait at anchorage before a berth became available. COVID-19 disruption at major Chinese and Vietnamese ports have also resulted in long queues of ships waiting in this part of the world. In other cases, liners actively avoid certain ports in their schedules.
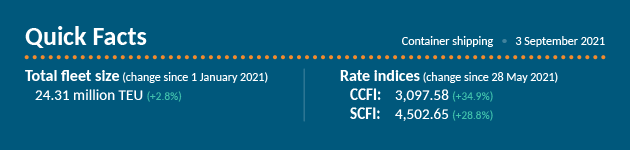
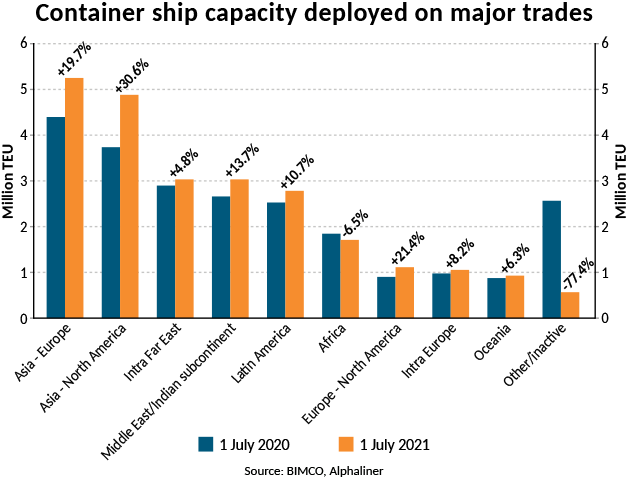
The delays mean that more ships are needed to maintain scheduled sailings. Alphaliner has estimated that the number of ships on the two main east-west trades (Far East to Europe and Far East to North America) rose to 10.12m TEU on 1 July 2021, representing 41.4% of total fleet capacity and up from 34.6% a year earlier.
Capacity on the Far East to Europe trade has risen 19.7% over the past year to 5.25 million TEU, while capacity on the Far East to North America trade has risen 30.6%.
Even with these extra ships, carriers are struggling to meet their scheduled departures, which leads to cancellations of sailings or port calls because the supply is not there rather than due to a lack in demand.
However, adding capacity on already congested trade lanes does little to solve the fundamental problems. The limiting factor is not capacity on board ships, but rather how many containers the ports and hinterland connections can manage, as well as storage space in temporary container yards and final destinations. Adding more ships means more revenue for carriers, but also longer waiting times outside ports and increasing capacity issues on the smaller trades where the added ships are taken from. This is clear in Africa, where capacity has fallen by 6.5% year-on-year. The large year-on-year increases in capacity can also be contributed to the sharp reduction in the idle fleet compared to July 2020.
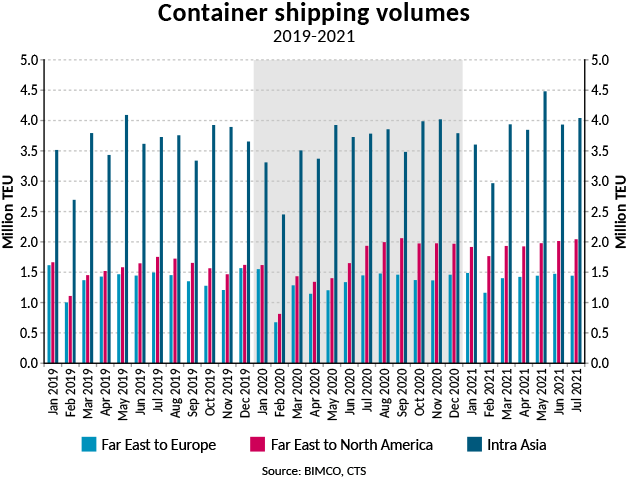
Compared to volumes, the 30.6% increase in capacity on the Far East to North America trade is in line with a 28.3% increase in volumes on the same trade in June 2021 compared with June 2020. Volumes reached 2.0m TEU in July compared with 1.9m TEU in July 2020, which was up from 1.8m TEU in July 2019. Comparing the first 7 months of 2021 with the same period in 2020, accumulated volumes are up by 33.3% at 13.6m TEU. Compared to pre-pandemic 7M 2019, volumes are up by 26.6%.
Conversely, on the Far East to Europe trade, capacity has increased at a rate almost twice as high as volumes. Compared to July 2020, volumes are up by 13.8%, while they were up only 0.1% compared with July 2019.
In the first half of 2021, growth on the Far East to Europe trade was much more in line with that in the rest of the world than the transpacific trade. Excluding volumes on the latter, global container shipping volumes were up by 9.3% from the first seven months of 2020, but by just 3.0% from the same period in 2019. This is in line with supply growth and further proof that the current strength of the market is not caused by fundamentals but rather by congestion issues driven by strong growth on the world’s second busiest trade.
On the world’s largest trade, intra-Asia, volumes in the first seven months of the year have risen to 26.8 m TEU, an 11.3% increase from the first seven months of 2020 and up 7.8% from 2019.
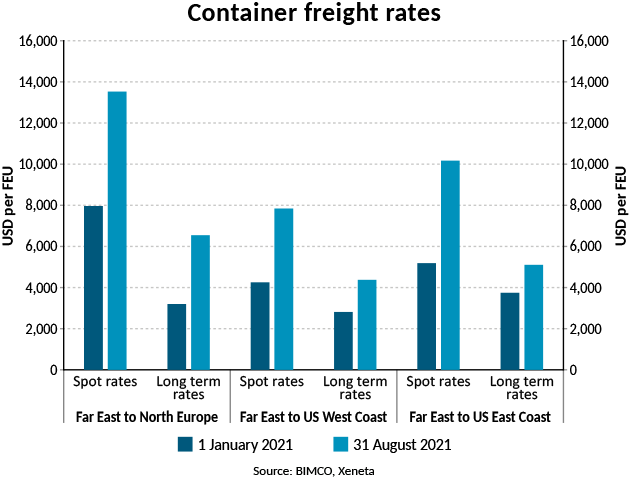
Higher freight rates are the main attraction for capacity being moved from smaller trades to the main east-west lanes. On the Far East to North Europe route, base spot rates stand at USD 13,526 per FEU, with long- term rates at USD 6,544 per FEU. On the Far East to US West Coast trade, the spot and long-term rates were at USD 7,868 per FEU and USD 4,378 per FEU, respectively, on 31 August. Additionally, some shippers are paying thousands of dollars in surcharges to ensure their load gets on board a ship in time.
Fleet news
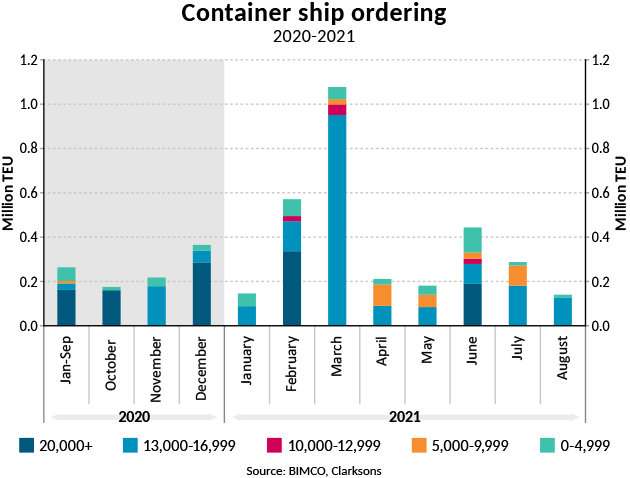
A look at the supply side of the container shipping market confirms carriers’ desperation to get hold of tonnage. Looking at the shipbuilding yards, 386 ships with a total capacity of 3.4 million TEU have been ordered so far this year. This has filled the yards for 2023 and 2024, when 1.6m TEU and 1.5m TEU respectively are scheduled for delivery. A further 375,000 TEU is already scheduled for delivery in 2025 as delivery earlier than this becomes harder to secure.
The most popular container ships on order are those with a capacity of 13,000 to 16,999 TEU. 146 ships of this size with a total capacity of 2.1m TEU have been ordered so far this year. In the 20,000+ TEU ULCS range, 22 ships with a total capacity of 0.5m TEU have been ordered.
For those wanting to add tonnage more immediately, the sale and purchase market is also heating up. A total of 363 ships have changed hands so far this year and prices are rising as availability of second-hand ships for sale is tightening. Prices disclosed so far clearly show that values are rising fast. Referencing disclosed sales prices for container ships, the average price per TEU has jumped more than 400% this year. In January, sales were completed at an average price of USD 2,300 per TEU; by August, the average price stood at 12,900 per TEU.
Given the earning potential on both the freight and second-hand markets, the number of ships heading for demolition has stalled. Since June, only two 890 TEU fruit ships have been demolished, bringing the total demolished so far this year to 15 ships totalling just 11,681 TEU. The largest container ship to be demolished was the 27-year-old, 1,839 TEU Tasinge Maersk.
As long as the strong market continues and the new tonnage ordered this year is still in the process of being built, demolition rates will remain low. BIMCO expects demolition this year to fall to levels last seen in 2007, when 20,900 TEU was demolished, though a new record low will not be set as demolition in 2021 has already exceeded the 2,780 TEU demolished in 2005.
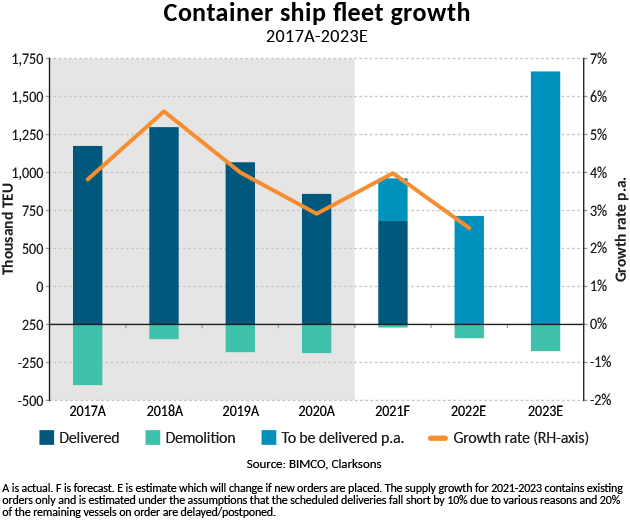
Of the capacity expected to be delivered in 2021, around two thirds has already arrived. In combination with the low demolition activity, it means the container shipping fleet has already grown by 2.5% this year. BIMCO expects another 280,500 TEU to be added to the 680,000 TEU that has already delivered, which will result in fleet growth of 3.8% over the full year.
Fleet growth is expected to slow down in 2022, before the many ships ordered at the end of 2020 and in 2021 are delivered, prompting a return to higher fleet growth in 2023 to 2025.
Outlook
Years of low freight rates resulting in rigorous cost cutting by carriers have left them in a great position to maximise profits now that the market has turned. Looking to the future, they have proven adept at using their upper hand at the negotiating table to lock shippers into longer-term contracts at today’s higher freight rates.
Similarly, tonnage providers had the upper hand with charterers. By early September, chartering a 3,500 TEU ship would cost USD 77,000 per day, while chartering an 8,500 TEU ship cost USD 115,000 per day (source: Harper Petersen). In addition to attractive higher charter rates, tonnage providers are managing to secure longer-term contracts. In recent weeks, however, the steep rise in charter rates has stopped, but this is more a reflection of the lack of tonnage available for charter rather than falling demand.
BIMCO expects the container market will remain strong well into 2022. Even as consumer demand for containerised goods begins to ease, there will be plenty of work to be done in clearing the backlog that has built up over the past many months, and lots of stocks that need to be restocked. The true test for the container shipping market will likely come in 2023, when the huge volumes of newbuilt shipping capacity ordered over the past year starts being delivered. Once this happens, the strength of the contracts currently signed may be tested as shippers and carriers, attracted by lower freight and charter rates, will try and get out of their obligations, as is always the case when a market recalibrates to a very different level.
Before this happens, however, the world will continue to watch the container shipping industry and its ability to deliver on its promise of delivering global trade, even though the bottlenecks preventing a return to normal are mostly outside of carriers’ controls in ports and warehouses. As proven by the increasing list of ships waiting to berth at the ports of Los Angeles, carriers adding more capacity doesn’t solve the problems on land.
The situation may get worse before it gets better. As long as China continues to pursue a zero-tolerance COVID-19 elimination strategy, the risk of more ports being closed or disruptions to hinterland connections remains high, adding to the time it that will take for the container shipping market to normalize.
At the top of everyone’s list will be ensuring schedule reliability and a return to the status quo in which the sea-transport of goods returns to smooth sailing, and not the current headache-provoking situation, albeit potentially at higher freight rates than shippers had enjoyed in the past decade.

